About

This site is an on going scientific study by Geologist David Jungblut. It is based on an independent study that I conducted with considerable on-the-ground field research over the past several years.

I have not asked for or received financial support for my observation, opinions and conclusion into Hurricane Katrina’s Destructive Powers.

This investigation was conducted by following normal rules of the Scientific Method.

All observation, pictures, conclusions posted on this website remain the property of David Jungblut, Geologist.

e-book and Smartboard PowerPoint available, request via email.

David Jungblut has a degree in Geology from Livingston College, Rutgers University. He worked for the United States Geological Survey focusing on stream flow hydrology for three years. David has done environmental consulting for radon and environmental sensitive land development in New Jersey. He spent time working in water and sewer treatment plants. For the past 21 years, he has taught science at Oakcrest High School in Mays Landing, New Jersey.

David Jungblut can be contacted at 1824 Dr. Foreman Drive Mays Landing, NJ 08330, Phone 609- 399-5845 or by E-mail: davidjungblut@hurricanekatrinastudy.com

By: David Jungblut, Geologist

Retired teacher at Oakcrest High School
1824 Dr. Foreman Drive
Mayslanding, NJ 08330
E-mail: davidjungblut@hurricanekatrinastudy.com

Peer review was done by Joe Hochreiter, senior environmental scientist from Yardley, Pennsylvania, Dr. Steven Lyons.

Articles

Mississippi Evidence of Wind and Water Damage; Hurricane Katrina Wind Study Conclusions from Gulfport Mississippi to Ocean Springs Mississippi, by David Jungblut, December 2006

Hurricane Katrina Straight Line Wind Field Study; Southwinds Golf Course Area near Ocean Springs, Mississippi, by David Jungblut, December 2006

Scientific Methodology for Study on Wind and Water Damage During Hurricane Katrina, by David Jungblut, December 2006

Geological Principles that Apply to the Hurricane Katrina Study, by David Jungblut, December 2006

Homeowners Guide to Dealing with Hurricane Damage, by David Jungblut, December 2006

Reinventing Local American Corporations, by David Jungblut, October 2008

Oakcrest students innovate solutions to oil spill, by By Michael Miller http://www.pressofatlanticcity.com/communities/hamilton/article_debbd6e5-e99c-542f-b09a-8d70da1f5174.html?mode=story

Videos

CBS Evening News with Katie Couric, Kid Solutions to BP Oil Spill, http://www.cbsnews.com/video/watch/?id=6549408n&tag=contentMain;contentBody or Kid Solutions to BP Oil Spill June 4, 2010 Today was a very exciting day in the Oakcrest Science Department. A correspondent from the CBS Evening News with Katie Couric visited Dave Jungblut’s 9th grade Physical Science class. Students were interviewed regarding their experiments and ideas on the oil spill in the Gulf of Mexico. CBS’s interest in our school sprouted from an Atlantic City Press article (link above) published last week.

Downbursts and Microbursts During Hurricane Katrina From: GeologistJungblut | July 13, 2007 http://www.youtube.com/GeologistJungblut#p/a/u/1/KrYkdRpP-wk

Hurricane Katrina Study of Wind Damage from Microbursts and Downbursts by Geologist Jungblut From: GeologistJungblut | July 13, 2007 http://www.youtube.com/GeologistJungblut#p/a/u/2/tpLfXn2bPTY

Hurricane Katrina Study. Microburst, Downburst, Wind Water Study, Website From: GeologistJungblut | July 14, 2007 http://www.youtube.com/GeologistJungblut#p/a/u/0/RwmeXzltmmo

Simple Solutions to the BP Gulf Oil Spill, this investigative report by filed Oakcrest High School Falcon TV field reporter Adrianna Martinez deals with Oakcrest HS science teacher Dave Jungblut in Southern New Jersey, whose class, and himself, have come up with logical solutions to the oil spill in the gulf coast. Dave and his class were recently featured on ABC nightly news with Katie Couric for their solutions to the spill as well.

NEW TALK SHOW IS A FORUM FOR GETTING THE WORD OUT-IT INVITES GUESTS TO SHARE THEIR STORIES AND PROBLEMS, AND OUR HOSTS AND GUESTS PROVIDE THE RESOURCES AND SOLUTIONS TO THOSE EVERYDAY PROBLEMS IN OUR WORLD AND COMMUNITY. OUR FIRST GUEST IS SCIENCE TEACHER DAVE JUNGBLUTT WHO HAS A SOLUTION TO THE BP OIL DISASTER. http://www.youtube.com/watch?v=tYt0QM0eVh0

David Jungblut Youtube Channel

Presentations

Rutgers University, Piscataway http://www.dimacs.rutgers.edu/wst/
Hurricane Forensics
Presenter: Dave Jungblut 2006, 2007
Imagine your home destroyed and your insurance claim denied, what do you do? Geologist David Jungblut will present teacher and student-friendly lessons, labs and activities that demonstrated how he used geological and forensic inquiry techniques to discover straight-line winds from microburst activity took place during Hurricane Katrina that helped thousands of homeowners in Mississippi. Evaluate local and world wide environmental issues like land use risks and benefits in the face of global warming.

Should we rebuild New Orleans? Oakcrest High School, May 2008

Power Point Presentation was sent Ralph Avallone as per his request, Ralph@greenenergycouncil.com

Chess

Oakcrest Chess Team 1991 to 2010 Coach
South Jersey High School Chess League, President 1995 to 2006
Coach of the Year 2007
The New Jersey State Chess Federation (NJSCF), Board Member 2008-2010
Chess Tournaments at Oakcrest High School 1991-2010

Bridge

Oakcrest Bridge Team 2005-2010 Coach
ACBL Goodwill Committee 2008
Bridge Tournaments at Oakcrest 2006-2010

Climate change and the 2017 hurricane season

School lesson plan featured on: PBS NEWSHOUR EXTRA: Climate change and the 2017 hurricane season

Lesson plan: Climate change and the 2017 hurricane season

The 2017 Atlantic hurricane season marks one of the fiercest in recorded history with a total of 17 named storms, including 10 hurricanes. In this NewsHour lesson plan, students study the storms that ravaged the southeastern region of the U.S. and the Caribbean and investigate connections between climate change and extreme weather events.

Grades

7-12

Objectives

To examine the hyperactivity of the 2017 Atlantic hurricane season and explore how changes in the Earth’s climate affect the severity of storms.

Essential question

What might extreme storms during the 2017 hurricane season tell scientists about the role of climate change?

Overview

Some notable facts about the 2017 Atlantic hurricane season:

  • Hurricane Harvey hit Houston, Texas with 50 inches of rain in a very short period of time.
  • Hurricane Irma devastated the infrastructure in the Caribbean and Florida.
  • Hurricane Maria hit Puerto Rico leaving about 60 percent of Puerto Rico without power months later.
  • The 2017 hurricane season is one of the costliest on record with an estimated total of more than $367.56 billion in damages, nearly all due to Hurricanes Harvey, Irma and Maria.
  • At least 198 people were killed in these three hurricanes. However, the number of deaths from Hurricane Maria is expected to rise as many deaths are believed to not have been recorded.

Warm up activity

  • Students will look at a website of the Earth that depicts wind speeds and pollution. The website ‘Earth Nullschool’ (https://earth.nullschool.net/) shows the forecast by supercomputers using an interactive animated map.
    • Observe and discuss what is shown on the website, such as wind pattern, CO, CO2, and SO2.
    • Based on the class discussion, students should jot down a few ideas that interested them to research in more depth. They don’t need to settle on a topic just yet.
  • Students should also check out the National Hurricane Center’s website (http://www.nhc.noaa.gov/) to check on current disturbances and the tropical weather outlook over the 5 days.

Main activity

Jigsaw and video activity:
  • Divide the PBS NewsHour article, “First Harvey, now Irma. Why are so many hurricanes hitting the U.S.?” into 5 or 6 sections.
  • In class, create groups of 5 or 6 students and assign each student to learn one segment. Be sure to give students only their assigned segment.
  • Students should read their segment at least two times, so they understand it. Be sure to jot down a few key ideas.
  • Form new groups by having one student from each jigsaw group join other students assigned to the same segment. Have students jot down one or two key points from each student’s summary. Create a short list as to why so many hurricanes hit the U.S. and Caribbean in 2017.
  • Next, watch the video “Did climate change make recent extreme storms worse?” located at the bottom of the story, also posted below.
    • Ask students to take notes on how extreme weather events (i.e. hurricanes) may be related to global warming as well as some of the challenges in contributing a specific event to global warming.
    • Have students take another look at the essential question for this lesson. For the last part of the lesson, have students write down three questions they would like to ask the scientists featured in the video based on the essential question. Choose a few questions and have your class send them to the scientists (or look up climate science professors at a nearby college or university and send to them). Remind your students that curiosity and the ability to ask questions are a must for scientific inquiry!

New Orleans Hurricane Katrina Levee Report

Copyright © 2006, 2009, 2010 by David Jungblut.  All rights reserved. No part of this publication may be reproduced or distributed in any form or by any means, or stored in the database or retrieval system, without prior written permission of David Jungblut, Ocean City, New Jersey.

Why Did the New Orleans Levees Fail?

By Geologist David Jungblut 

The thesis advanced in this article will show recently-uncovered evidence indicating that downburst energy, in the form of microbursts, generated straight-line winds and could have been part of the mechanisms resulting in the failure of the New Orleans levees during Hurricane Katrina.

Why did the New Orleans-area levees fail?  This is one question left unanswered, even after an extensive review by the federal government was published in “Technical Note 1476: Performance of Physical Structures in Hurricane Katrina and Hurricane Rita: A Reconnaissance Report”, by the National Institute of Standards and Technology (NIST).  The NIST report stated: “The mechanisms should be fully investigated using rigorous models and experimental analysis before firm conclusions can be drawn.”  I suggest that the models will be inconclusive unless microburst and straight-line energy are taken into account in the models with the equivalent level amount of energy level that my study indicates.  Microburst (a downburst that is smaller than 4 Km in size) and straight-line energy were part of Hurricane Katrina’s assault on Mississippi, and the following evidence will show that microburst and straight-line energy were part of the storm that hit New Orleans and surrounding areas, as well, and a possible factor in the destruction of the levees.  

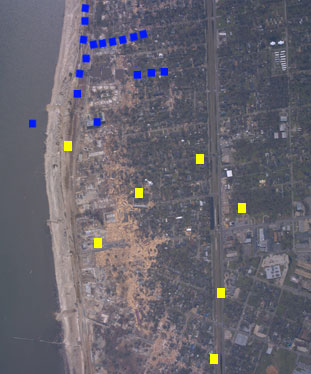
The following map shows the location of a series of photographs that depict storm damage in the New Orleans-area.  

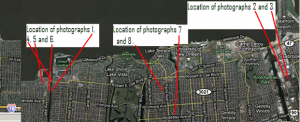
The following series of photographs that depict storm damage in the New Orleans-area, with annotations presented following each photograph:

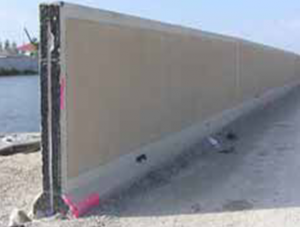
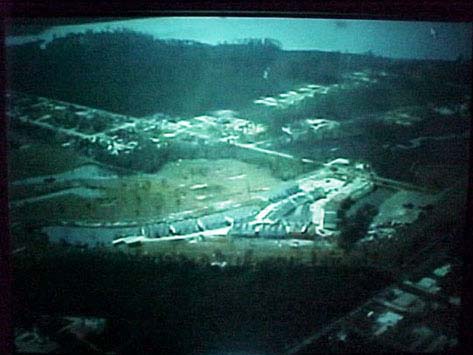
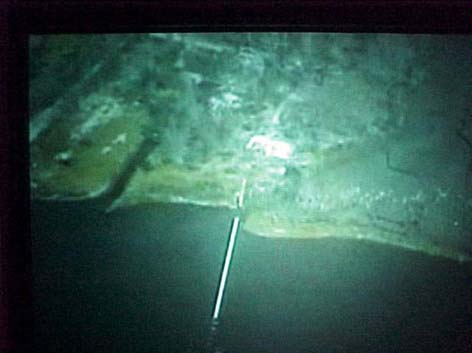
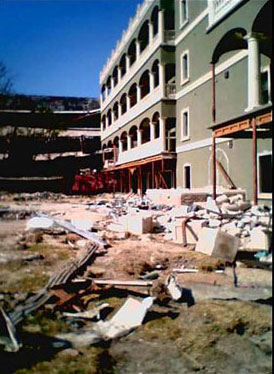
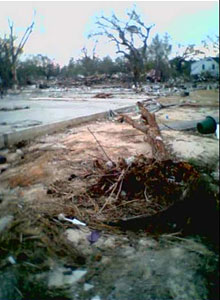
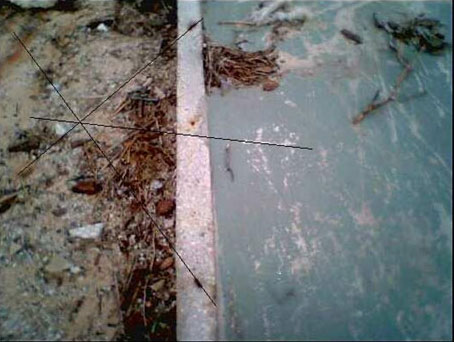
Photograph 1:  View of the breach at the 17th Street Outfall Canal (Credit: Page 83, NIST TN 1476, Reconnaissance Report – Hurricanes Katrina and Rita)

The 17th Street Outfall Canal carries discharged water from Jefferson Parish and New Orleans Parish to Lake Pontchartrain. The concrete levee system was beached at N30 00.972 latitude W90 07.239 longitude; this beach caused extensive flooding of New Orleans Parish.  The flood protection wall in this photograph looks to be unaffected and shows no signs of stress due to the hurricane, but the next section is missing.  

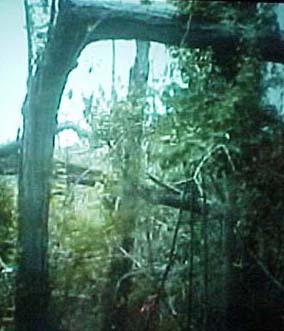
Can water alone place stress on one section of levee and the adjoining section unaffected?  Water alone cannot do that, however, wind can cause just this effect in the form of straight-line winds from microbursts.  The jet-like currents of air can impact a discrete area and leave nearby areas unaffected.  Searching National Oceanic and Atmospheric Administration’s (NOAA) Hurricane Katrina images at noaa.gov, one can locate evidence that microbursts and associated straight-line winds were active during Hurricane Katrina as shown in the next photograph near the breach at Jourdan Road.

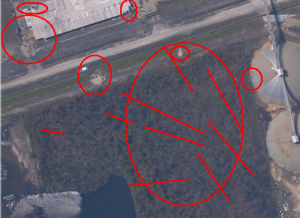
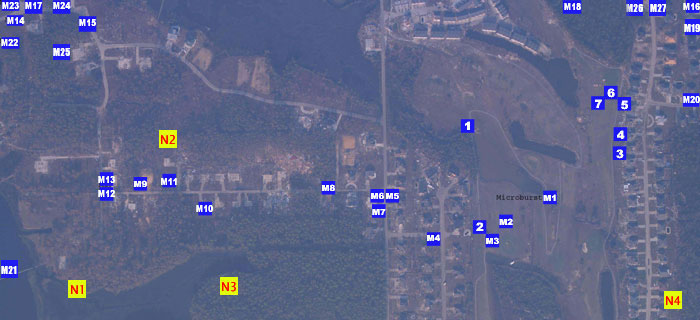
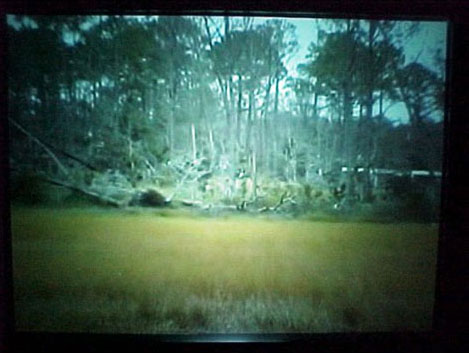
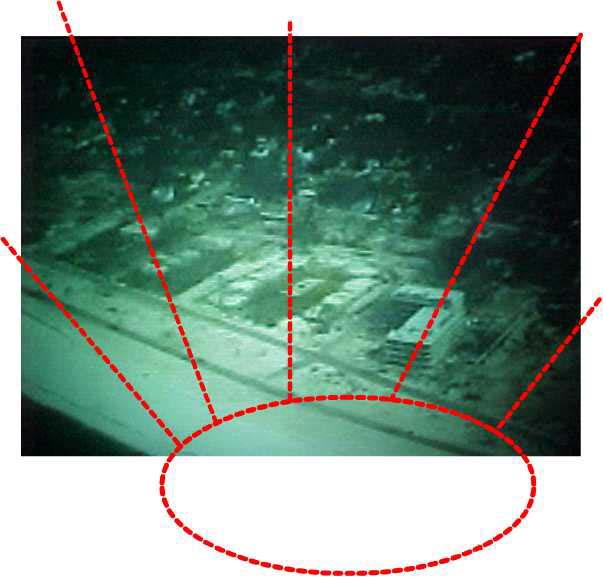
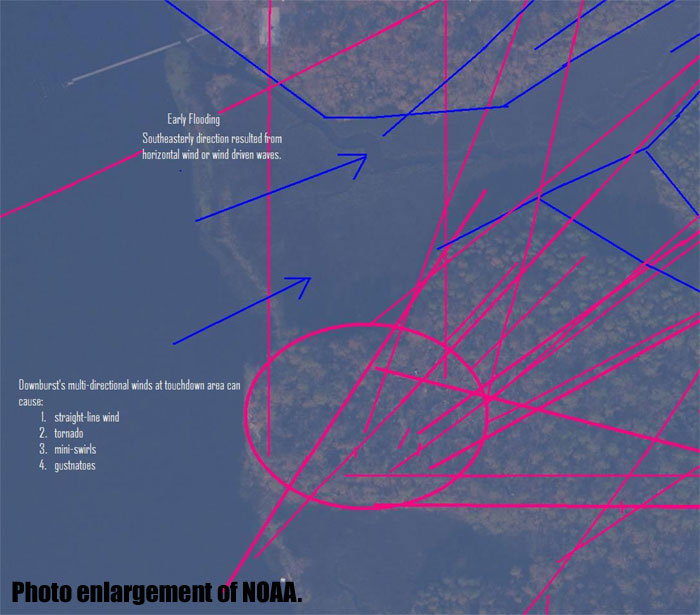
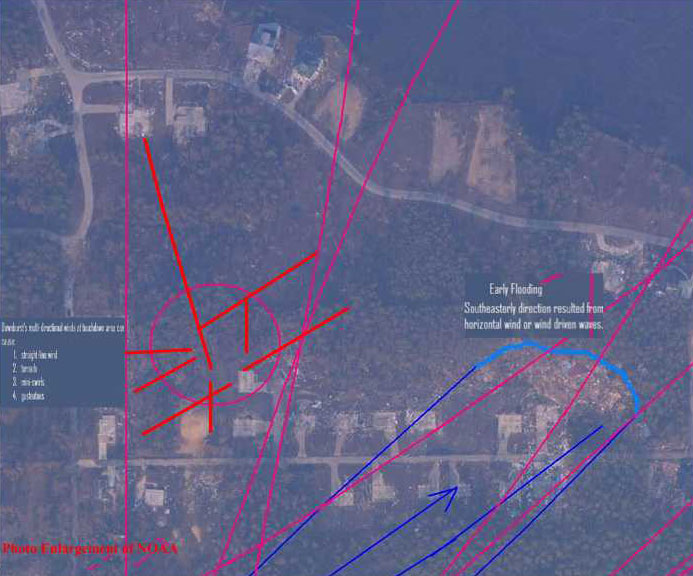
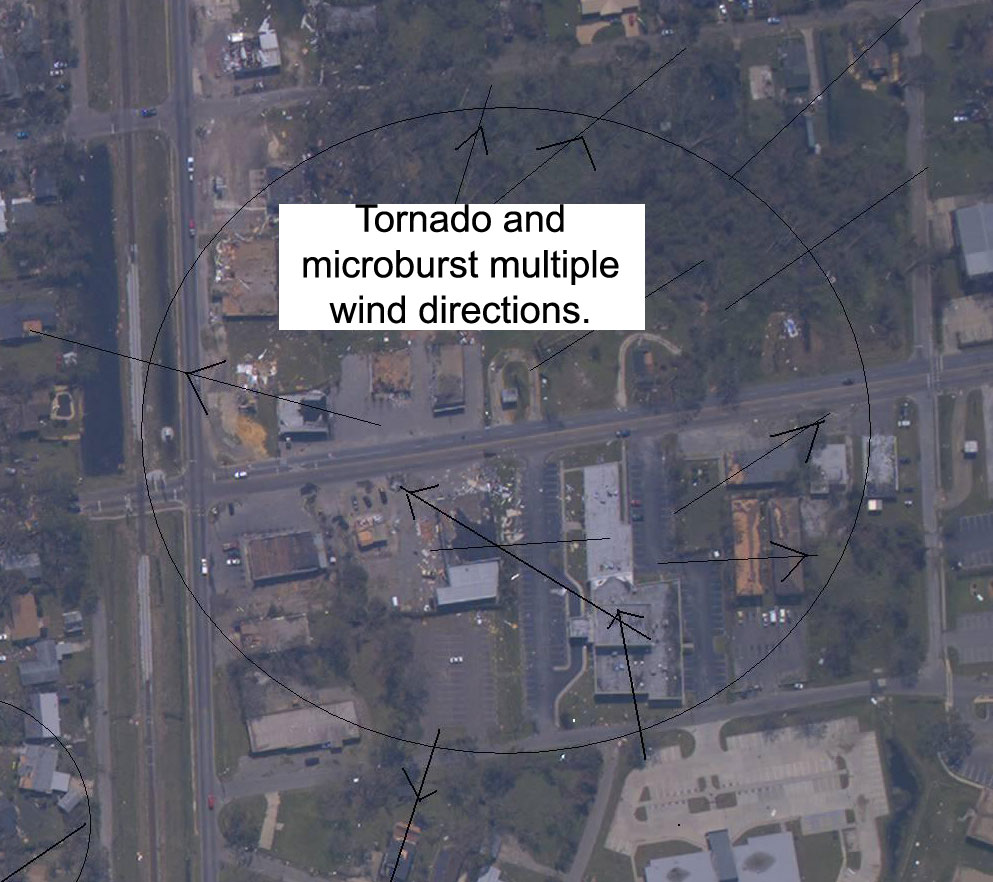
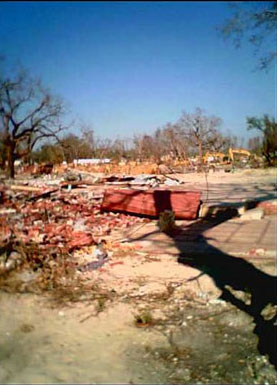
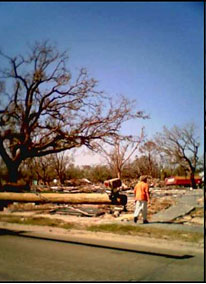
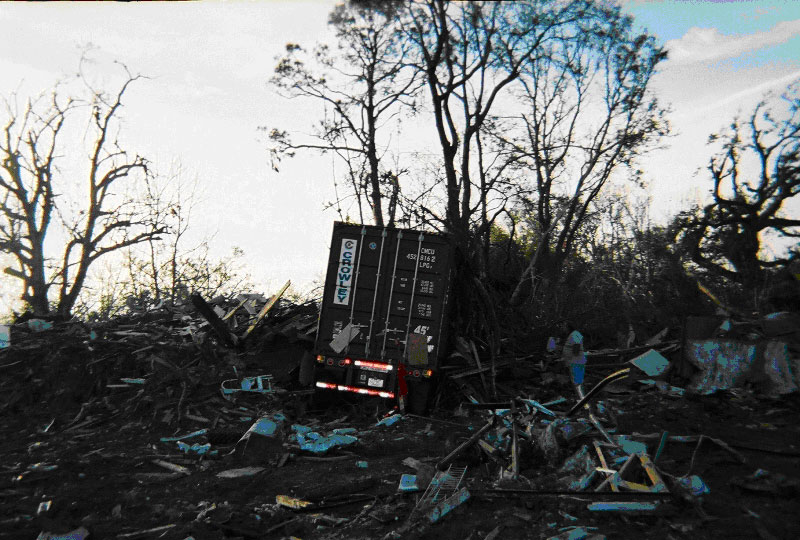
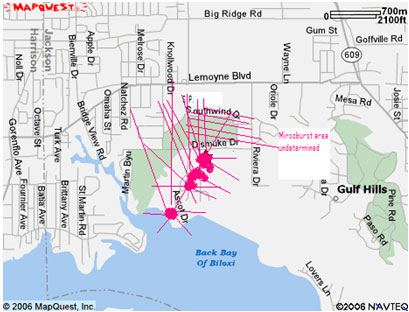
Photograph 2:   View of a microburst area on Jourdan Road between Morrison and Dwyer Road near the Inner Harbor Navigation Canal (Credits: NOAA Image 24425508 and analysis by David Jungblut)

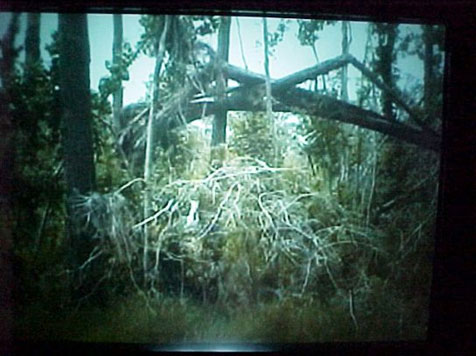
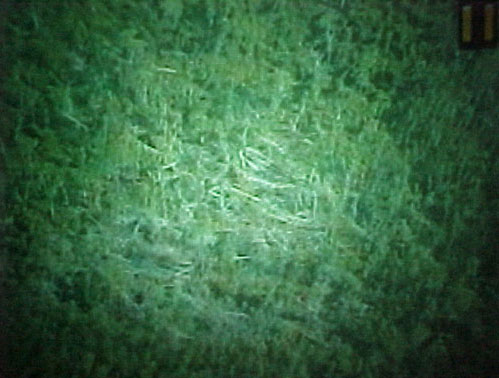
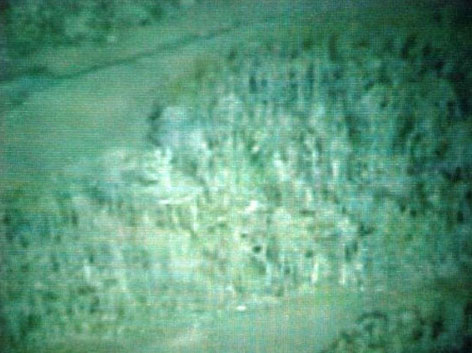
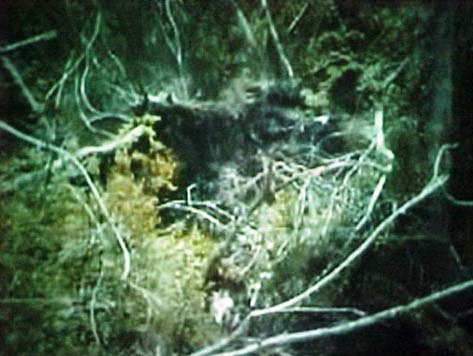
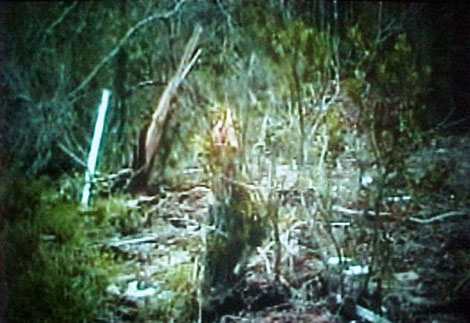
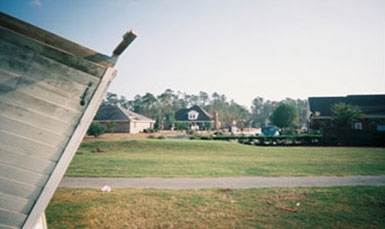
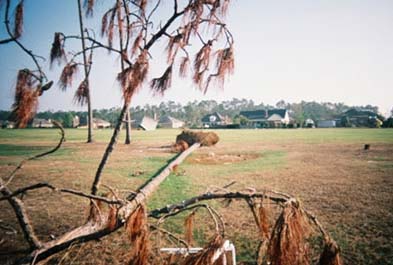
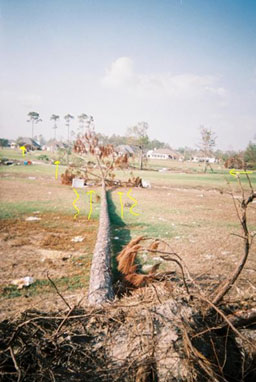
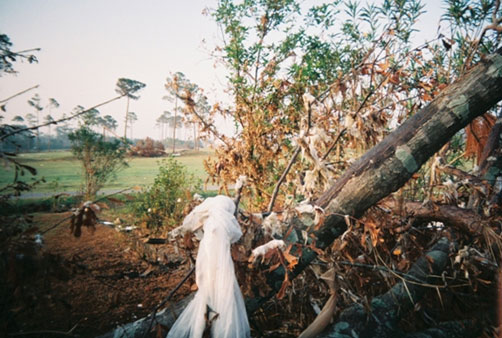
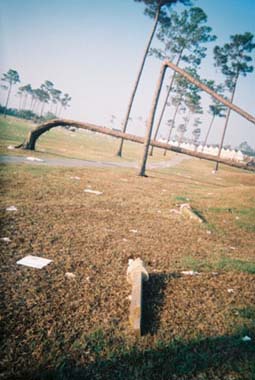
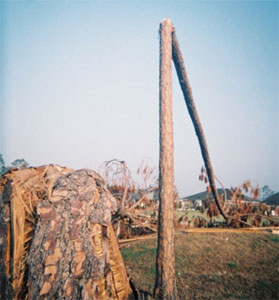
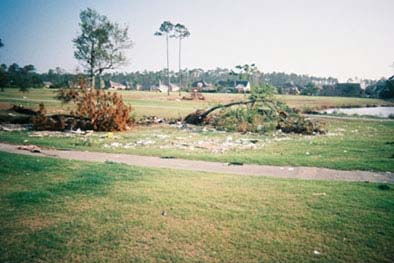
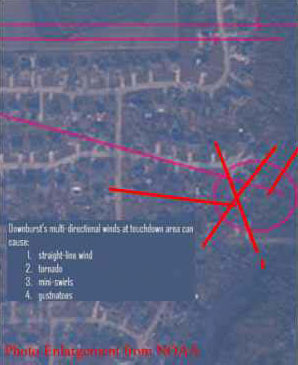
The large red circle painted on the NOAA image, shows a microburst (a downburst that is smaller than 4km).  The red lines show the star-burst pattern in which the trees fell; this indicates that multiple wind directions were present during Hurricane Katrina.   The small circle lines indicated damage to the surrounding buildings, along with possible ground damage to the road embankment on Jourdan Road.   A close up of the area shows the trees falling in multiple directions.

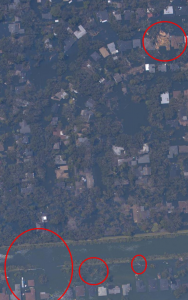
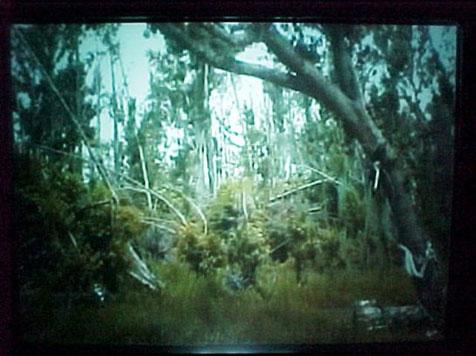
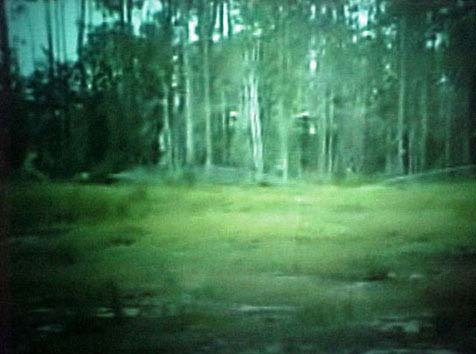
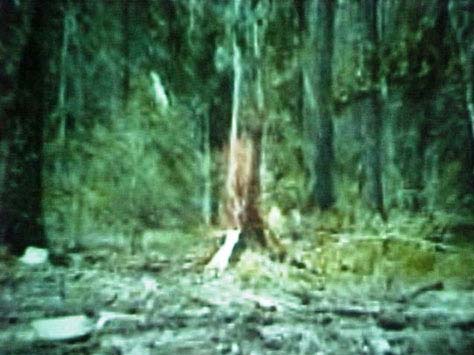
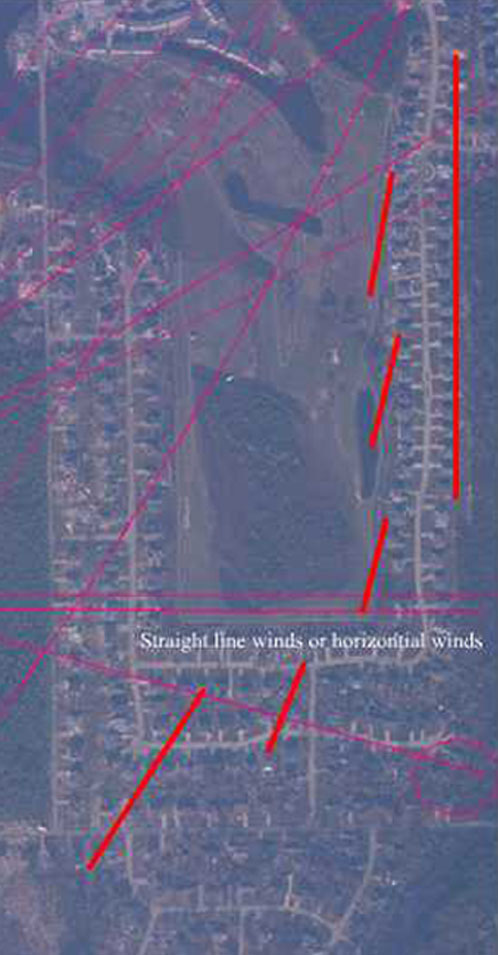
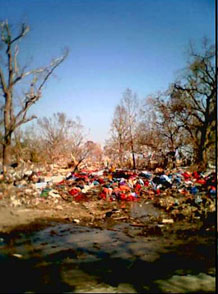
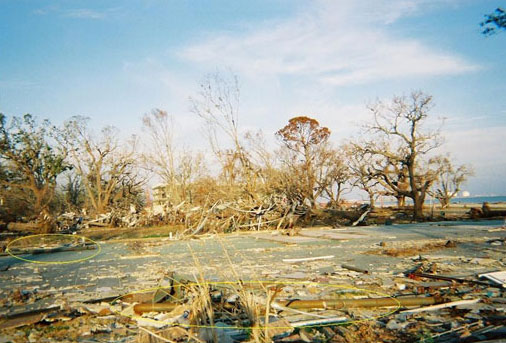
Photograph 3:   A close up of the microburst area on Jourdan Road between Morrison and Dwyer Road near the Inner Harbor Navigation Canal (Credits: Google-Imagery and U.S. Geological Survey, map data)

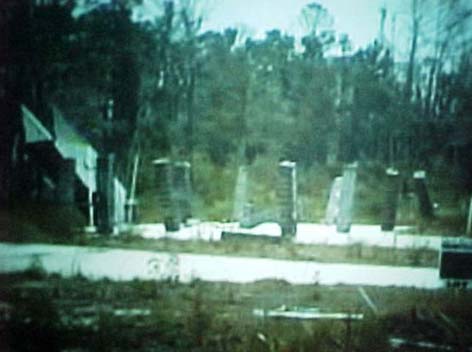
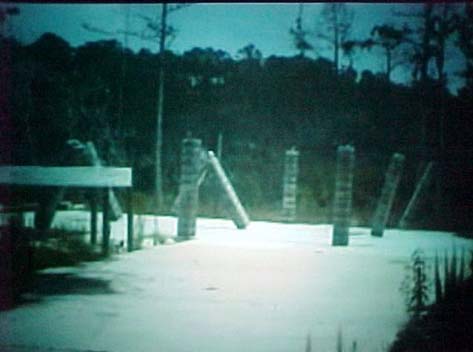
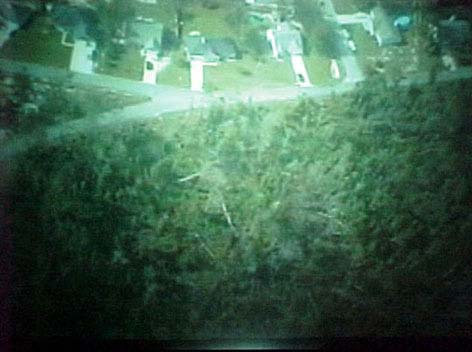
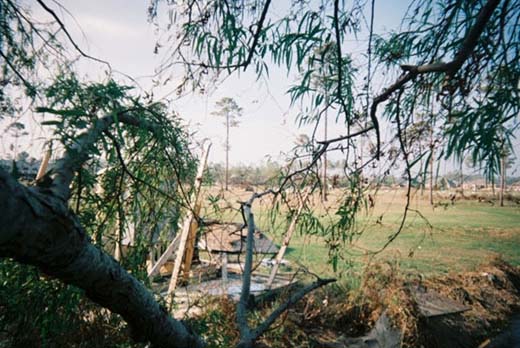
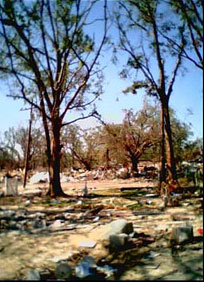
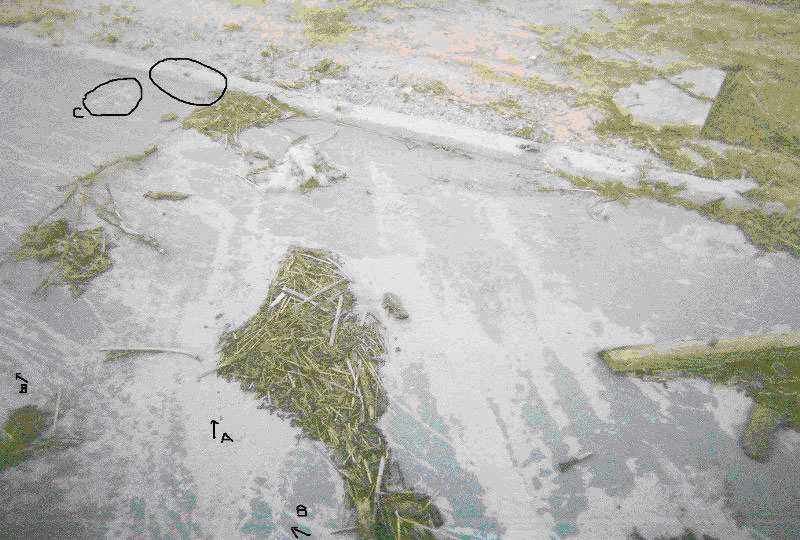
The next photographs (#4 to #6) were taken between the breach that occurred at 17th Street Outfall Canal (See Photograph 1) and Lake Pontchartrain.  

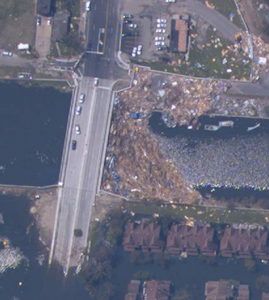
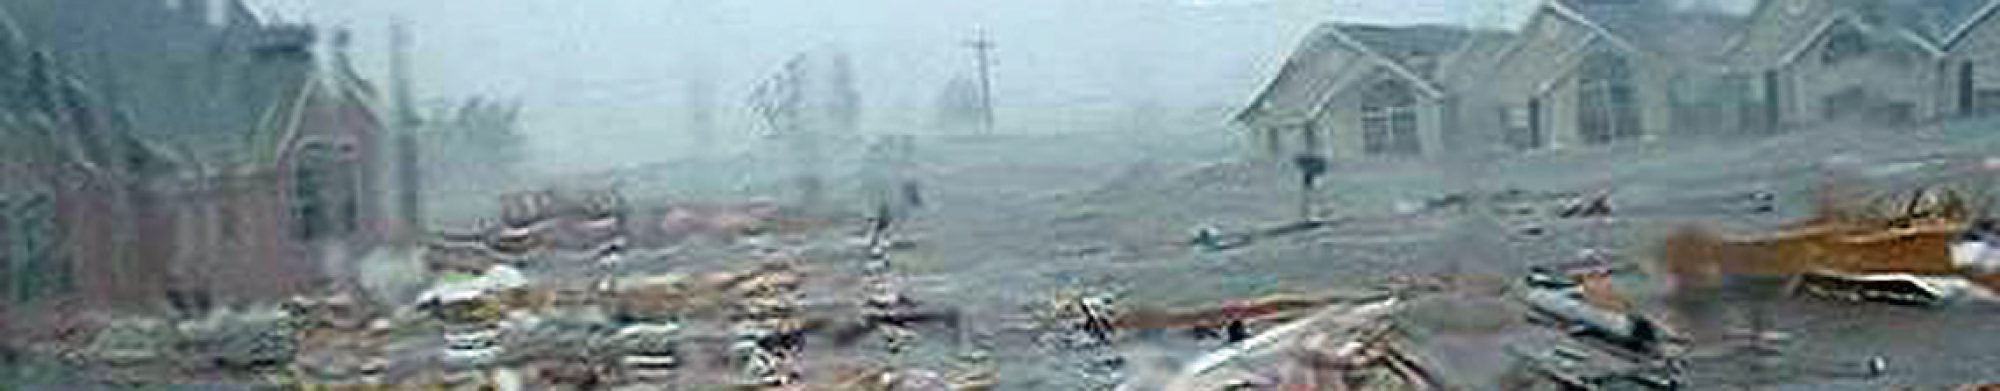
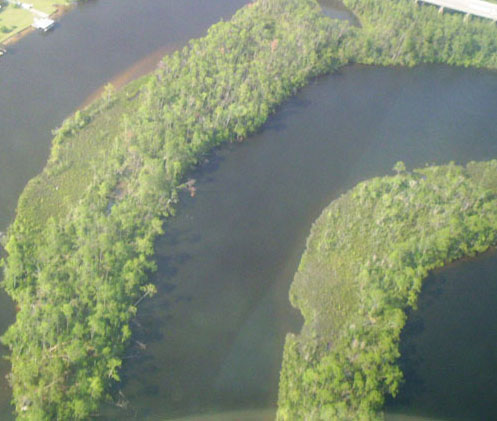
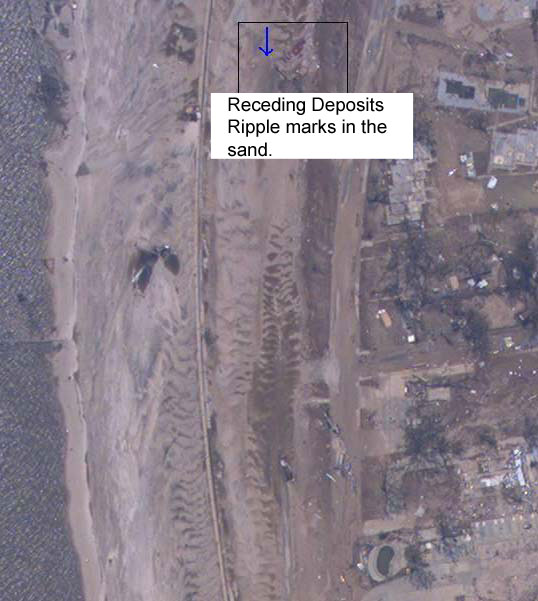
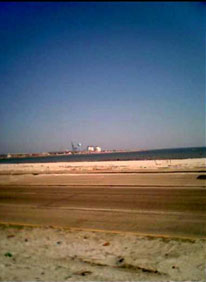
Photograph 4:  17th Street Outfall Canal close to Lake Pontchartrain (Credits: NOAA Image)

The area took a heavy beating during Hurricane Katrina with debris hitting the walls of the levees and the bridge as shown in Photograph 3.  The bridge and levees in this area acted as a dam that blocked the inward flow of debris, but both the bridge and levee walls in this area held up well and were not breached.

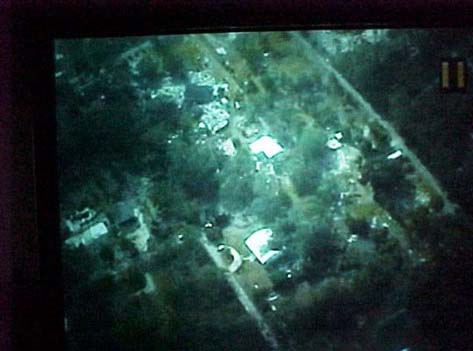
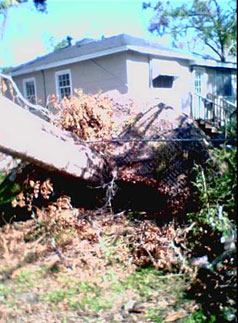
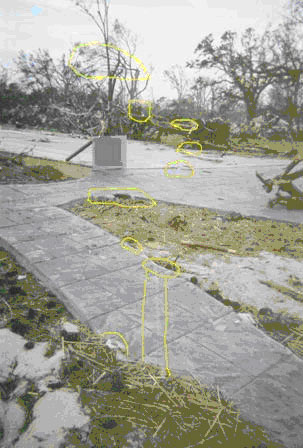
Closer inspection reveals that some buildings in the area did suffer damage from strong winds, as seen the Photograph 5.  

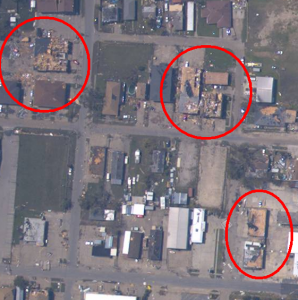
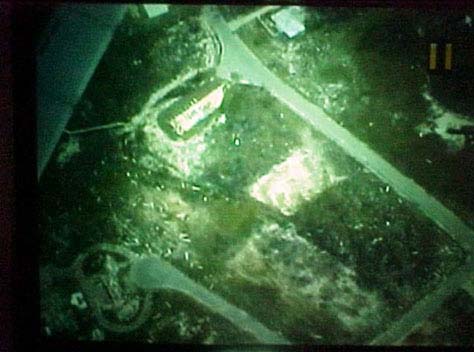
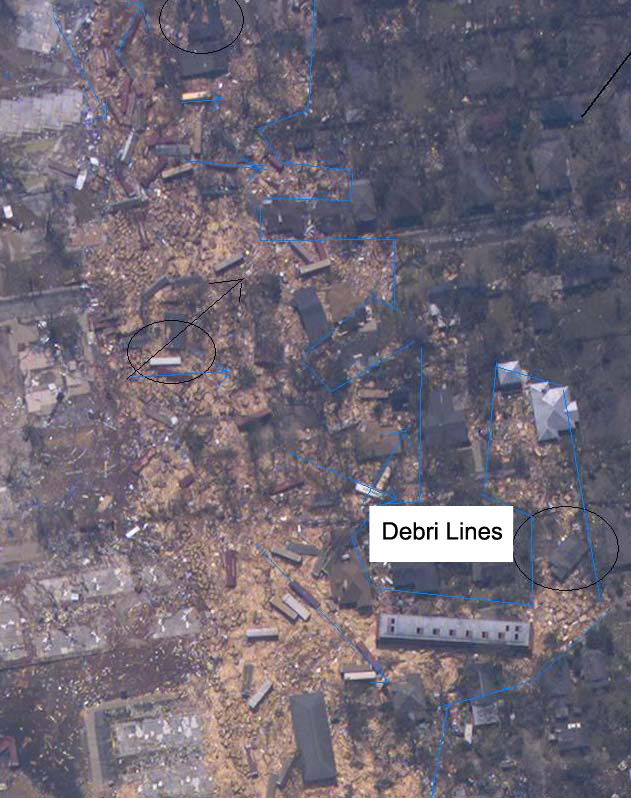
Photograph 5 (Credits: NOAA Image and analysis by David Jungblut)

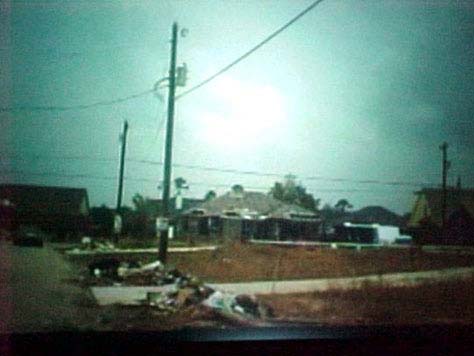
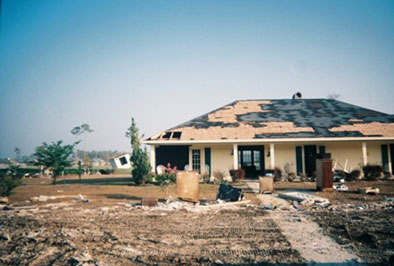
The circled buildings show evidence of strong wind damage: the tin roofs of the buildings in the lower right were peeled back; the roof of the one middle building was also peeled back and the other middle building shows multiple-direction wind damage; and the building in the upper left looks to have taken a direct hit from a small microburst causing three fourths of the building to be “blown” apart with debris scattered on three sides.    


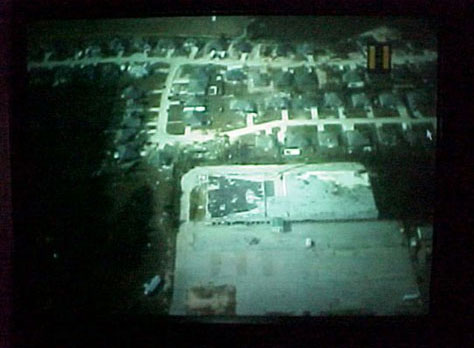
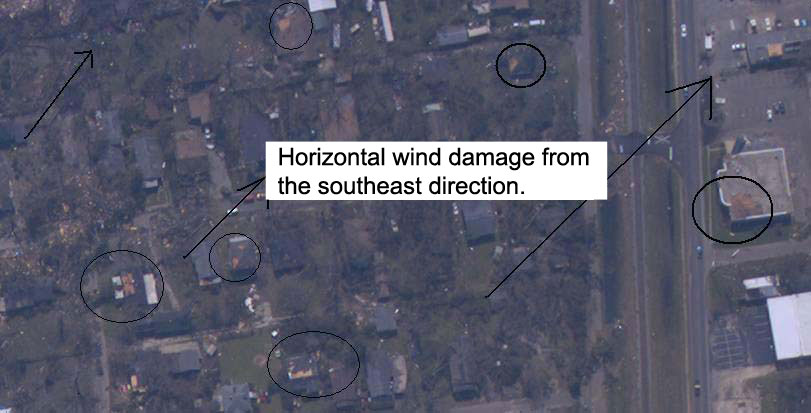
The next photograph shows that the breach at 17th Street Outfall Canal and the surrounding neighborhood experienced wind damage.

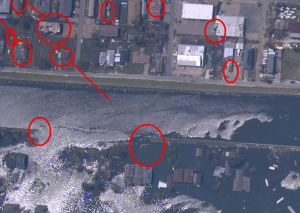
Photograph 6 (Credits: NOAA Image and analysis by David Jungblut)

Photograph 6 shows the heavy flooding flowing into New Orleans Parish at the breach.  Some of the buildings just north of the breach show roof damage that can be attributed to strong winds.

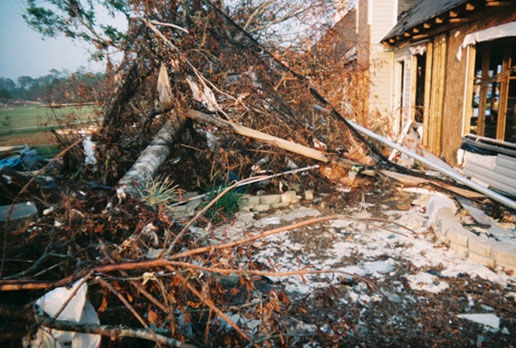
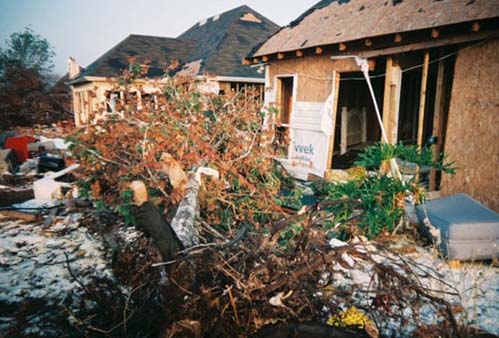
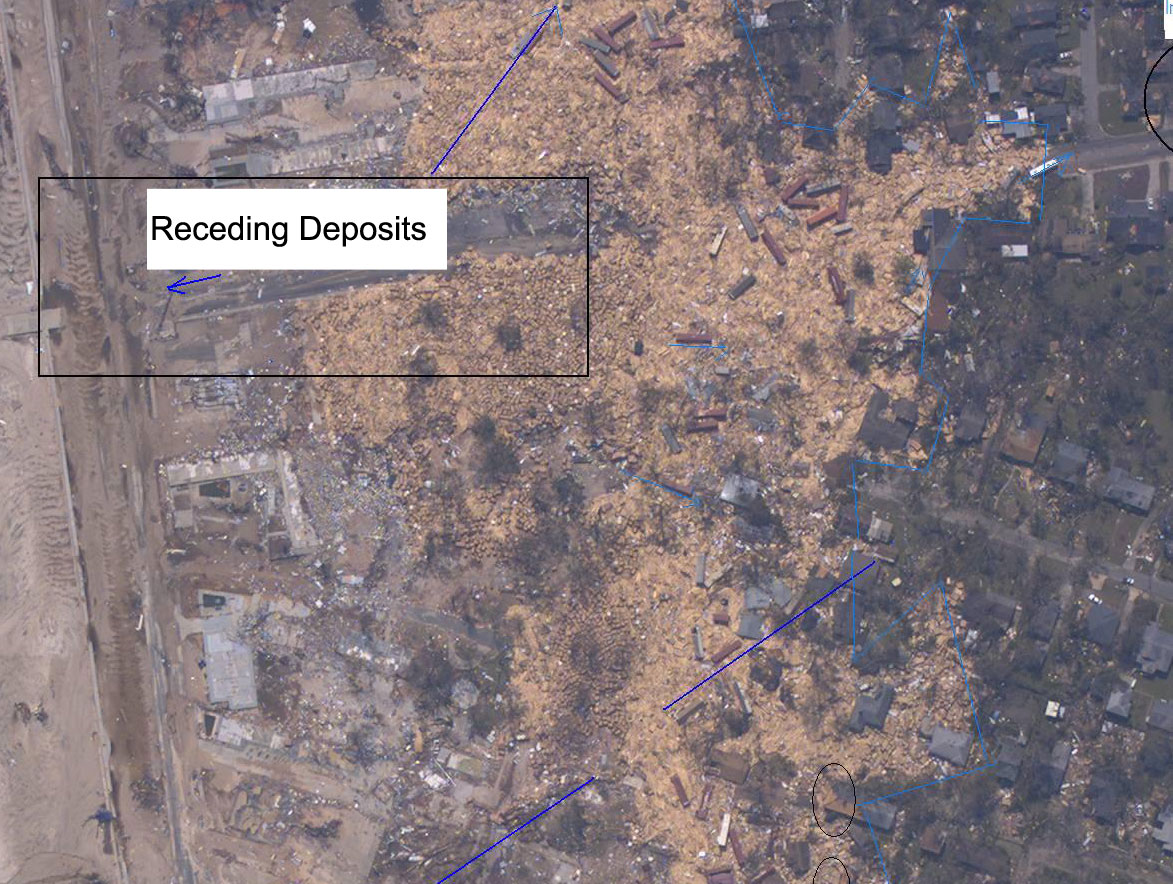
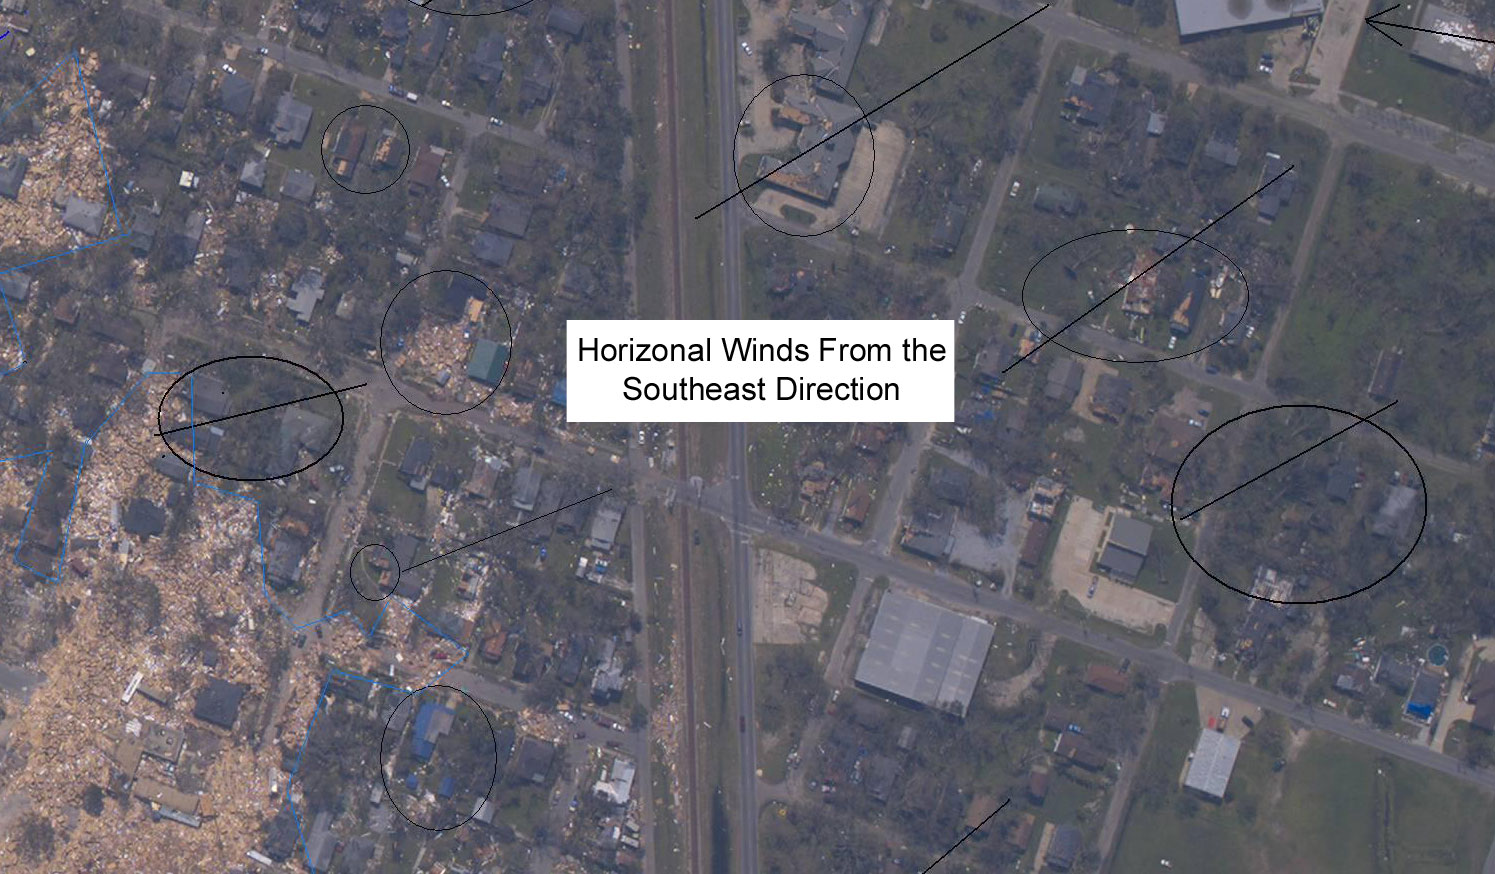
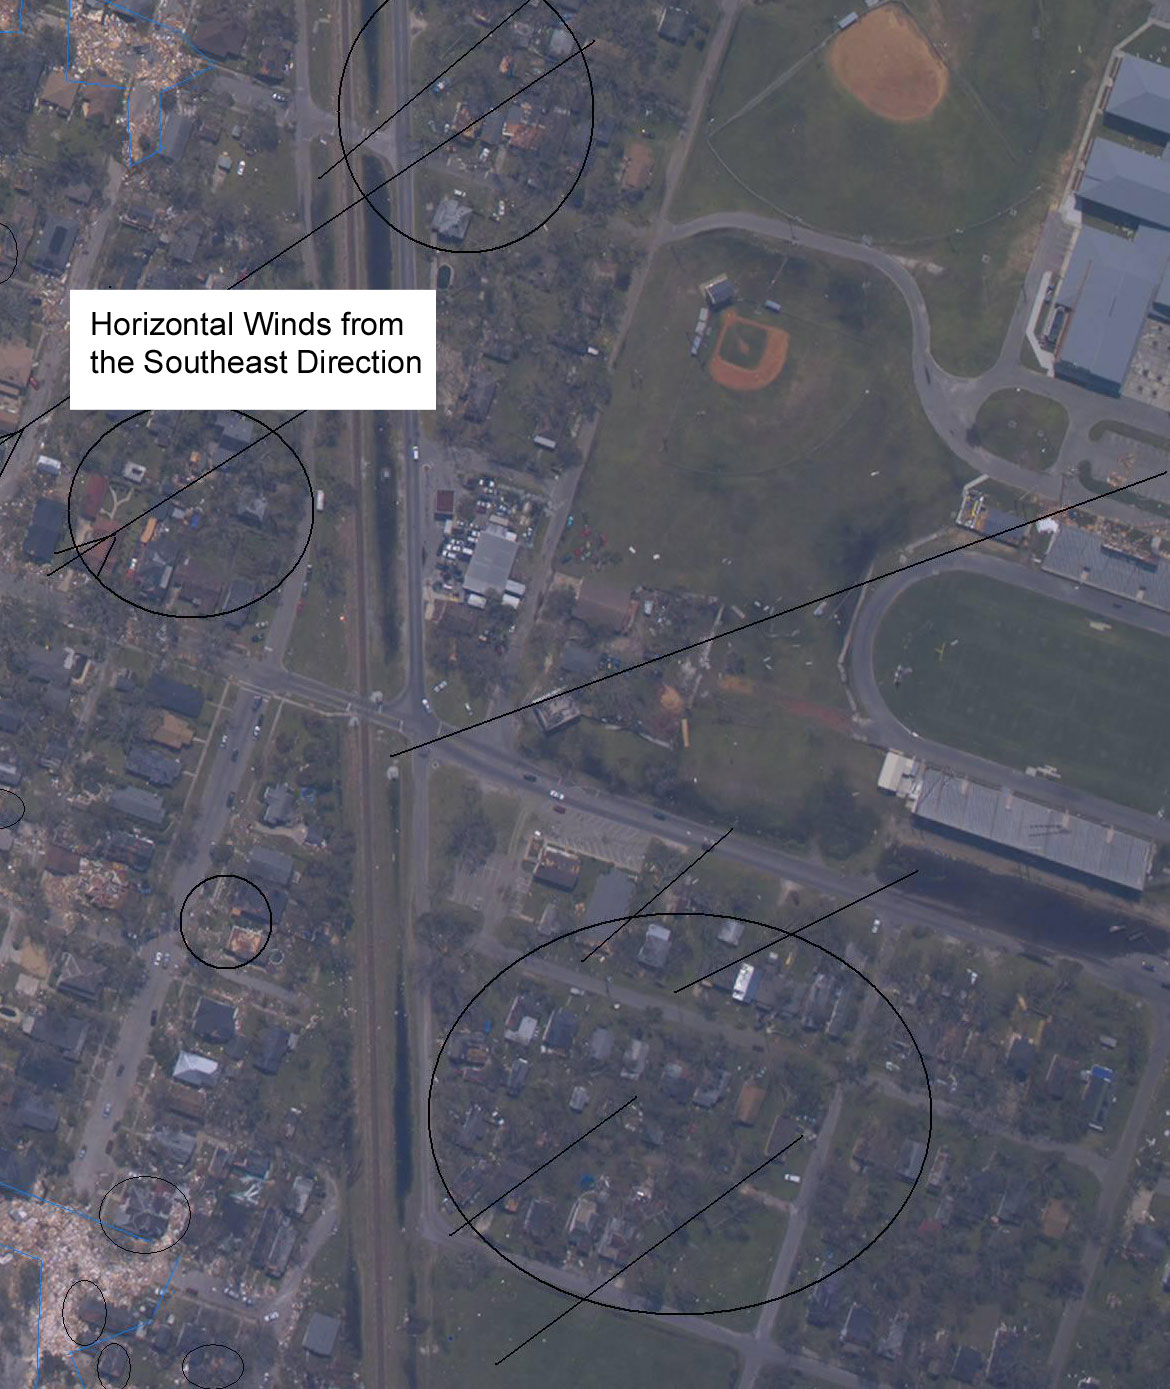
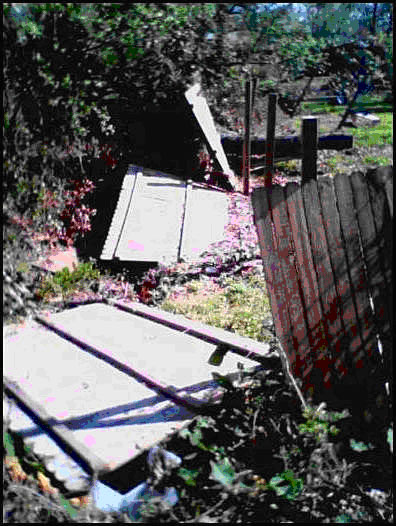
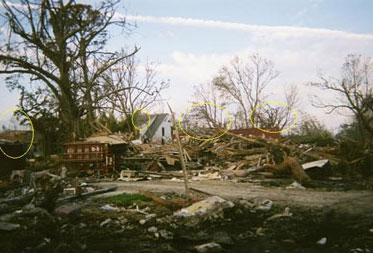
Further south near one of the two breaches at London Avenue, two other buildings were “blown apart” with debris scattered in three directions, as if a small microburst hit them.  See Photographs 6 and 7.  

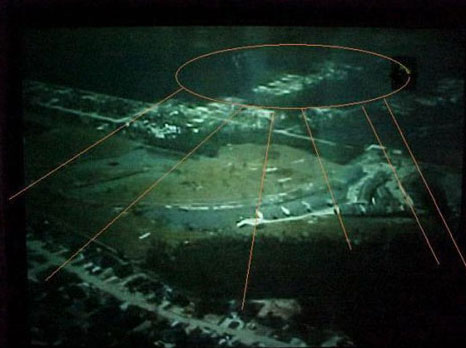
Photograph 7 and 8(Credits: NOAA Image and analysis by David Jungblut)

In photograph 7, the large circle shows the breach at London Avenue and the upper right circle shows the house that experienced a microburst.  Photograph 8 shows another house that was hit by microburst energy, demonstrating that high winds were active in the area during Hurricane Katrina.  Applying the Fujita Tornado Damage Scale (with the appointed damage as a guide), we can estimate the wind speed at 207 to 260 miles per hour.   The Fujita Tornado Damage Scale is provided at the end of this document.

It is legitimate to query:  If these houses experienced downburst winds could these same winds have impacted the levee system? The following warning was indeed issued on the day Hurricane Katrina approached.  

http://www.srh.noaa.gov/data/warn_archive/LIX/TOR/0829_133900.txt

000

WFUS54 KLIX 291337

TORLIX

LAC051-057-071-075-087-089-291400-

/O.NEW.KLIX.TO.W.0090.050829T1336Z-050829T1400Z/

BULLETIN – EAS ACTIVATION REQUESTED

TORNADO WARNING

NATIONAL WEATHER SERVICE NEW ORLEANS LA

836 AM CDT MON AUG 29 2005

THE NATIONAL WEATHER SERVICE IN NEW ORLEANS HAS ISSUED A

* TORNADO WARNING FOR CATASTROPHIC WINDS FOR…

 JEFFERSON PARISH IN SOUTHEAST LOUISIANA

 THIS INCLUDES THE CITIES OF…TIMBERLANE…METAIRIE…MARRERO…

 KENNER…HARVEY…AVONDALE

 LAFOURCHE PARISH IN SOUTHEAST LOUISIANA

 THIS INCLUDES THE CITY OF CUT OFF

 ORLEANS PARISH IN SOUTHEAST LOUISIANA

 THIS INCLUDES THE CITY OF NEW ORLEANS

 PLAQUEMINES PARISH IN SOUTHEAST LOUISIANA

 THIS INCLUDES THE CITIES OF…PORT SULPHUR…BELLE CHASSE

  1. BERNARD PARISH IN SOUTHEAST LOUISIANA

 THIS INCLUDES THE CITY OF CHALMETTE

  1. CHARLES PARISH IN SOUTHEAST LOUISIANA

* UNTIL 900 AM CDT

* AT 832 AM CDT…MANY REPORTS ARE COMING IN STATING TOTAL  

 STRUCTURAL FAILURE IN THE NEW ORLEANS METRO AREA.


 SEEK SUBSTANTIAL COVER NOW!!! THIS IS A LIFE-THREATENING SITUATION.

A TORNADO WATCH REMAINS IN EFFECT UNTIL NOON CDT MONDAY FOR SOUTHEAST

LOUISIANA AND SOUTHERN MISSISSIPPI.

LAT…LON 2945 9036 2948 8953 3008 8922 3004 9040

(emphasis added)

Coinciding with these catastrophic wind warnings, three of the nine levees failed at about 9am.  The others followed within the next 24 hours.  The words in the warning seem to indicate the winds could have caused “STRUCTURAL FAILURE IN THE NEW ORLEANS METRO AREA” affecting all the levees during the “8:32 AM CDT” reporting window or immediately after.

In conclusion, the science of microburst and straight-line winds are a relatively new field of inquiry and not known to exist until Dr. T. Theodore Fujita described microburst and straight-line winds in the 1970’s.  The models that explain why the levees failed will be inconclusive unless microburst and straight-line energy is incorporated at the correct levels of energy within to the models.  The evidence indicates that microburst and straight-line winds speeds of 207 to 260 could have caused the walls of levees to fail.   

Fujita Tornado Damage Scale

Developed in 1971 by T. Theodore Fujita of the University of Chicago

SCALE WIND ESTIMATE *** (MPH) TYPICAL DAMAGE
F0 < 73 Light damage. Some damage to chimneys; branches broken off trees; shallow-rooted trees pushed over; sign boards damaged.
F1 73-112 Moderate damage. Peels surface off roofs; mobile homes pushed off foundations or overturned; moving autos blown off roads.
F2 113-157 Considerable damage. Roofs torn off frame houses; mobile homes demolished; boxcars overturned; large trees snapped or uprooted; light-object missiles generated; cars lifted off ground.
F3 158-206 Severe damage. Roofs and some walls torn off well-constructed houses; trains overturned; most trees in forest uprooted; heavy cars lifted off the ground and thrown.
F4 207-260 Devastating damage. Well-constructed houses leveled; structures with weak foundations blown away some distance; cars thrown and large missiles generated.
F5 261-318 Incredible damage. Strong frame houses leveled off foundations and swept away; automobile-sized missiles fly through the air in excess of 100 meters (109 yds); trees debarked; incredible phenomena will occur.

During the summer of 2005, David Jungblut spent time in New Orleans as Hurricane Katrina approached and later did a scientific investigation into the damage that the hurricane inflicted because homeowners’ insurance claims were being rejected. Insurance companies claimed that all damage was due to flooding and not wind.  David Jungblut pointed out that wind damage was visible.  He wrote reports about his findings, all pro bono.  Later he posted his findings at http://www.hurricanekatrinastudy.com/  that was available to homeowners, engineers and lawyers free of charge.

David Jungblut has a degree in Geology from Livingston College, Rutgers University.  He worked for the United States Geological Survey focusing on stream flow hydrology for three years.  David has done environmental consulting for radon and environmental sensitive land development in New Jersey.  He spent time working in water and sewer treatment plants.  For the past 21 years, he has taught science at Oakcrest High School in Mays Landing, New Jersey.

David Jungblut can be contacted at 1824 Dr. Foreman Drive
Mays Landing, NJ 08330, Phone 609- 399-5845 or by E-mail: davidjungblut@hurricanekatrinastudy.com , djungblut@geh.nj.k12us.com

Peer review was done by Joe Hochreiter, senior environmental scientist from Yardley, Pennsylvania.

Confidentiality – Avis de confidentialite
The information transmitted is intended only for the addressee and may contain confidential and/or proprietary material. Any unauthorized review, distribution or other use of this information, or the taking of any action in reliance upon this information, is prohibited. If you received this in error, please contact the sender and delete or destroy this message and any copies.

Straight Line Winds Research

During the study I rented an airplane and pilot to fly over the research area. The YELLOW MARKERS on the maps are images taken from the airplane. These aerial pictures reveal evidence of straight line winds during Hurricane Katrina.

Ocean Springs, Mississippi

Picture 9: This picture was taken looking west on Crescent Shore Drive.
The trees are bent in different directions. Bent Trees in Different Directions

Hurricane Katrina Bent Trees in Woods

Picture 10: This picture was taken looking west on Crescent Shore
Drive. The house was built on concrete pillars. The pillars now point in
different directions. The house must have crashed straight downward as the
air dropped down, blowing the foundation pillars into a starburst pattern,
i.e., going in different directions. Concrete Pillars in Starburst Pattern

Hurricane Katrina Foundation Damage

Picture 11: This picture was taken looking east on Crescent Shore Drive.
The house was built on concrete pillars. The pillars now were pointing in
different directions. The house must have crashed straight downward as the
air dropped down, blowing the foundation pillars into a starburst pattern,
i.e., going in different directions.Wind Drops Pillars in Different Directions

Hurricane Katrina Damage to Home Foundation

Picture 12: This picture was taken looking east on Crescent Shore Drive.
The tree broke and started to fall northward, then split and fell toward
the east. Tree Fallen in Two Directions

Broken Tree

Picture 13: This picture was taken looking northwest from Hummingbird Lane.
Three trees are twisted together.

Hurricane Katrina Trees Twisted

Picture 14: This picture was taken looking east on Ascot Drive. The downed
trees fell north, south and west. Trees Fallen in Different Directions

Downed trees in Starbust Pattern Directions

Picture 15: This picture was taken looking southeast on Ascot Drive. The
fence is down in two different directions, southeast and northwest. Fence Down in Two Different Directions

Hurricane Katrina Tree Study

This picture was taken from an airplane, while looking down at a microburst
behind a housing development near Ocean Springs. Aerial of Microburst

Aerial Photo Microburst

This picture was taken looking northeast from an airplane at Ascot Drive.
The trees in the center of the photograph are down in different directions. Aerial View of Trees Down in Different Directions

Aerial View Trees Down In Different Directions

Picture M18: This picture was taken looking down on townhouse complex at Southwinds
Golf Course. One straight-line wind went through the townhouse complex, from
a southeast to a northwest direction. Crescent Shore Drive and Ascot Drive are
in the upper right of the picture. Wind Through Townhouse Complex

Hurricane Katrina Aerial Picture of Microburst

Picture M27: This picture was taken close to I10 trees fell in different directions,
showing the classical starburst pattern of a microburst area. Classical Starburst Pattern of Microburst

Starburst Pattern of Microburst

This picture was taken looking down at a straight-line wind on an island
at Ocean Springs from an airplane. Straight-Line Wind on Island

Hurricane Katrina Microburst Downburst Tornado Studies

This picture was taken looking north east from an airplane at Crescent Shore
Drive and Hummingbird Drive where trees and buildings have experienced damage
from a microburst. Microburst Damages Houses

Downburst Microburst Hurricane Katrina

Picture 24: This picture was taken looking at Ascot Point. Debris is scattered
in different directions, showing a starburst pattern of a microburst area. Microburst Debris Starburst Pattern

Microburst Starburst Pattern

This picture was taken looking at Ascot Point. Debris is scattered in different
directions, and trees are down in different directions showing a starburst
pattern of a microburst area. Microburst Tree Starburst Pattern

Hurricane Katrina Starburst Pattern of Microburst Area

Picture 22, Description: This picture was taken looking north on Crescent
Shore Drive, Hummingbird Drive is at the upper part of the picture; Ascot
Drive is to the left. The trees in the center are down in different directions. Aerial View of Straight-Line Wind Downed Trees

Hurricane Katrina Biloxi Bay

Analysis by David Jungblut
This picture was taken looking northeast from an airplane near Southwinds
Golf Course. This wooded area shows evidence of a straight-line wind event. Straight-Line Winds

Straight Line Winds

This picture was taken looking south from an airplane.
1. This building has roof top damage to the left side of the building. This
indicates that this building experienced wind damaging forces on the left
side rather than the right side.
2. Update: I went back to this site this past summer (2007) and found evidence
that a small microburst had hit a church that was near this location and
a second small microburst had occurred at a nursery across the street. Building Damage on Only One Side

Hurricane Katrina Homes Destroyed

This picture was taken looking southeast from an airplane at Southwinds
Golf Course. The surrounding buildings have experienced straight-line wind
damage from a microburst that was centered at Crescent Shore Drive and Hummingbird
Drive in the upper center of picture. Straight-Line Wind from Microburst

Hurricane Katrina microburst

Picture M8: This picture was taken looking west on Crescent Shore Drive. The tree is splintered. Splintered Tree

 Tree Suffers Wind Damage

Picture 7: This picture was taken looking east on Crescent Shore Drive.
The downed tree shows, the wind direction come from the west. Wind From West

Hurricane Katrina wind direction

Picture 6: This picture was taken looking east on Crescent Shore Drive.
The two trees are splintered. Splintered Trees

Splintered Trees

Picture 5: This picture was taken looking north of Crescent Shore Drive
to a house on Dismuke Avenue.
1. The house on the right has holes in the roof and walls.
2. Tree is down between the two houses, showing the wind direction came
from the south. Wind Hits House from South

House Damage Roof Walls

Picture 4: This picture was taken looking north onto Southwinds Golf Course. It is the same house found on the left side in Pictures 2 and 3.
The front of the house shows considerable roof damage. Roof Shingles
1. The patterns that the remaining shingles shows is similar to the roofs
in Biloxi that I saw when following a straight-line wind path.
2. A hole in the roof is shown.

Hurricane Katrina Shingles Roofs Straight Line Winds

Picture M3: This picture was taken looking south toward the same two houses that
can be seen in Picture 2. They are on Nassau Circle West.
1. Damage to the house on the left includes a hole in the side roof and missing
shingles.
2. Damage to the house on the right includes damage to the corner back side of
the house. Damaged House Roof

Hurricane Katrina Study of House Damage

Picture 2: This picture was taken looking south. The tree shows the wind direction was from the south of Southwinds Golf Course, it is the same center tree found in Picture 1. Fallen Tree

Hurricane Katrina Research on Damage to Trees

This picture was taken looking toward the northwest. Two lines of force
can be seen:
1. The tree on the right shows that it fell from east direction to west.
This is similar direction to the wall damage in Gulfport and the roof damage
in the apartment complex in Biloxi.
2. The tree in the foreground is in the southeast to northeast line similar
to the tree, shed, tree line in Picture 1.
3. Other trees in the middle of the picture show the straight-line
wind path and indicates that these trees fell about the same time in
the same event. Fallen Trees

Tree Fallen from Hurricane

This picture was taken looking west. Two lines of force can be seen:
1. East to west direction line that is in the same line, or parallel to
the direction that the tree fell on the right side in Picture 2.
2. Southwest to northeast direction line indicated by the net and wood.
3. The tree fell happened first, the net and wood second. The geological
principle of superposition gives evidence
that the order of events during Hurricane Katrina was as follows: Firstly,
wind blows the tree down in an east to west direction. Secondly, flooding
covered it with the wood and the netting from the southeast to northeast
direction.
4. The tree on the right shows that it fell from the east direction to the
west a similar direction to the wall damage in Gulfport and the roof damage
in the apartment complex in Biloxi. The tree on the right side in Pictures
2 suffered similar damage. The netting and wood are found in the same southwest
to northwest direction as the flood in Gulfport. Superposition

Hurricane Katrina House Damage

This picture was taken looking southwest.
1. The tree in the foreground has fallen in an east to west direction line.
This is in the same line, or parallel to, the direction that the tree on
the right side in Pictures 2 and the tree in Picture 3 fell.
2. Southwest to northwest flood direction is indicated by cloth.
3. Two trees, center left, fell in the southeast to northwest direction
similar to the tree in the foreground Picture 2 and the shed line in

Hurricane Katrina Water and wind damage

This picture was taken looking east to west. Two lines of force can be seen:
1. The tree has fallen in an east to west direction line that is in the
same line, or parallel, to tree right side in Pictures 2, 3 and 4.
2. West to east flood direction line is shown by an orange string cross
over the tree.
3. The houses have both wind and water damage. So the tree most likely fell
when the house was damaged by the wind. The string indicates the damage
caused by water and its direction. Two Lines of Force by Houses

Hurricane Katrina Home Wind Damage

This picture was taken looking southwest. Two lines of force can be seen:
1. The foreground post indicated the flood direction, southwest to northwest.
2. The tree fell in the background in a southeast to northwest direction. Two Lines of Force on Golf Course

Hurricane Katrina Bent Tree

Picture 7: This picture was taken looking southwest. The trees
are the same as Picture 6. Two lines of force can be seen.
1. The trees fell in the wind event from the southeast to the northwest.
Neither of the two trees showed any evidence of collision.
2. The tree on the right had been deflected to the right.
3. This showed that the trees fell first, followed by the flood waters pushed
them, with only the smaller tree moving toward the right in the picture,
because of the flood waters from the southwest.
4. The tree on the left shows that it may have been twisted as it fell. Wind Event Causes Twisted Tree

Hurricane Katrina Tree Broken Tree Twisted

Picture M1, Description: This
picture was taken looking southeast from Southwinds Golf Course. Two
straight-line winds paths can be followed by the down trees:
1. The two trees in the foreground show straight-line winds came from the easterly direction.
2. The tree in the center is show straight-line winds come
from the southeasterly direction. Two Straight Line Wind Paths

Hurricane Katrina wind

Picture 1: This picture was taken looking northwest, with a destroyed shed
in the foreground, golf course in the middle. Houses line the golf course
on the far right. Apartments line the golf course on far left side.
1. The tree is pointing toward the northwest, so it fell from the southeast
direction.
2. The shed roof fell northwest of the building. Tree and Shed

Hurricane Golf Course

Hurricane Katrina

Shared research about Hurricane Katrina that caused record breaking damage and widespread destruction from August 23-30, 2005.

Hurricane Katrina Study of Wind Damage from Microbursts and Downbursts

Hurricane Katrina Video Wind Events Verse Storm Surge/Flood Waters

A lot of the Hurricane Katrina Damage was caused by both wind and water. Identifying what specifically caused damage to a building or a tree is often difficult to distinguish. In this video, David Jungblut points out what homeowner insurance companies blamed on water may have in fact been destroyed by wind first.

Downbursts and Microbursts During Hurricane Katrina

Hurricane Katrina Study Video Evidence of Microbursts and Downbursts

A relatively unknown natural phenomena are downbursts and microbursts that can occur under certain severely unbalanced weather conditions such as during a hurricane. David Jungblut shares the evidence of downbursts and microbursts that he found on the Gulf Coast of Mississippi during Hurricane Katrina.

Hurricane Katrina Study. Microburst, Downburst, Wind Water Study

Hurricane Katrina Study Video Website Walkthrough and Research Information

David Jungblut, the Geologist built this site to share his explanations into the damage caused by Hurricane Katrina that he found during extensive studies of the Mississippi Gulf Coast cities of Gulfport, Biloxi and Ocean Springs and Louisiana’s famous cultural city of New Orleans. David guides you on a tour of the Hurricane Katrina Study website and discusses his scientific research findings.

Much of the Hurricane Katrina Study was focused on microbursts, downbursts and other wind events.

Aerial Photographic Evidence

During the study I rented an airplane and pilot to fly over the research area. The YELLOW MARKERS on the maps are images taken from the airplane. These aerial pictures reveal evidence of straight line winds during Hurricane Katrina.

Gulfport, Mississippi

Hurricane Katrina Gulfport Mississippi

Markers on map show photographic evidence collected in the Gulfport, Mississippi research study into straight line winds during Hurricane Katrina. BLUE MARKERS show images from ground level. YELLOW MARKERS show images taken from an airplane.

Hurricane Katrina’s Destructive Power of Microbursts – Downbursts – Tornadoes – Straight Line Winds

Photo enlargement of NOAA. Receding Deposits

<>Hurricane Katrina Receding Deposits

Photo enlargement of NOAA. Ripples

Ripples in Sand from Receding Deposits

Photo Enlargement of the NOAA picture. Aerial View of Horizontal Winds

http://www.hurricanekatrinastudy.com

This picture was taken looking northwest from an airplane as it moved
toward the four story building seen in another picture, just passing the
west side of Gulfport Pier.
1. This four story building has roof top damage.
2. Other pictures and locations show damage from this direction, marked
with the oval.
3. This shows that a microburst happened within the circled area and sent
high wind into the surrounding area. Aerial View of Microburst

Hurricane Katrina Microburst Roof Damage Evidence

Gulfport Study: Debri Lines

Hurricane Katrina Debri Lines

Photo by Geologist David Jungblut

Ocean Springs, Mississippi Study shows multi-directional winds at Downburst touchdown area.

Microbursts

Photo by Geologist David Jungblut. Straight Line Winds Photo Diagram.

Hurricane Straight Line Winds

Photo by Geologist David Jungblut. Straight Line Winds or Horizontal Winds

Hurricane Katrina Tornadoes Microburst Downbursts

Hurricane Katrina wind events caused by downbursts. Downburst Touchdown Causes Various Wind Events

Photo by Geologist David Jungblut

Aerial Picture of Straight Line Wind

Photo enlargement of NOAA. Ripples Air View

Ripples in Sand from Receding Deposits

Photo enlargement of NOAA. Receding Deposits

Hurricane Katrina Receding Deposits

Photo enlargement of NOAA.

Gulfport Study Horizontal Damage

Horizontal Wind Damage Hurricane Katrina

Photo enlargement of NOAA. Microburst Tornado

Hurricane Katrina Tornado and Microburst

Photo enlargement of NOAA.

Gulfport Study Horizontal Winds

Horizontal Wind Destruction Hurricane Katrina

Photo enlargement of NOAA.

Gulfport Study Horizontal Southeast Winds

Hurricane Katrina Horizontal Wind Evidence

This picture was taken looking north from Route 90. Tractor Trailer Moves Around Building
1. This four story building has damage to the lower floors on the right
side of the building, but considerably greater damage to the upper floor’s
left side in the back of the building. This indicates that this building
has experienced more damaging forces on the left side than the right side.

2. A tractor-trailer box can be seen in the corner of the building. The
tractor-trailer box could not have moved directly from the Gulfport Pier
to this location since it would have hit the other side of the building–
the southeast side. This shows that the tractor-trailer box moved west
or possibly northwest from Gulfport Pier, and was then forced to move
back toward the east or northeast.

Building Study Hurricane Katrina

This picture was taken looking toward the northwest from Route 90. A path
can be seen between the trees.

Route 90 Straight Line Wind Path

This picture was taken looking toward northwest from Route 90. A path can
be seen between the trees. Microburst Evidence

Straight Line Wind Path Hurricane Katrina

This picture was taken looking toward northwest from Route 90. A path can
be seen between the trees. Microburst Paths

Hurricane Katrina Wind Path Through Trees

This picture was taken looking toward northwest from Route 90. A path can
be seen between the trees. Microburst Wind Evidence

Gulf of Mexico Wind Path near Homes

This picture was taken looking northwest from Route 90. A path can be seen
between the trees. Microburst Wind Paths
I continued to walk down Route 90 and counted nine paths. Four paths are
shown in the other Gulfport Hurricane study pictures.

Route 90 wind paths

This picture was taken looking southeast at the Gulfport Pier from Route
90. Tractor Trailers in Gulf of Mexico
1. In the water, I can see tractor-trailer boxes but they can not be seen
in this
photo.
2. Tractor-trailer boxes were the line of force, in the direction as the
trees and house in Picture 7, the tree in Picture 8 and the fence in Picture
10.

Tractor Trailer Hurricane Katrina

This picture was taken northwest of Picture 8 and was in the same line
of force as Pictures 7 and 8.
1. The fence was hit hard in the middle.
2. The angle the fence sections are laying shows fence was hit from the
southeast toward the northwest.
3. Top of the flooded area.

Hurricane Katrina Top of Flooded Area

This picture was taken looking northeast at the crest of the flood area,
up the street from the houses in Picture 7. The tree fell in the same line
that the trees in Picture 7 are leaning. All the trees are pointing from
the southeast toward the northwest. Consistent Tree Lines

Fallen Tree near House Hurricane Katrina

This picture was taken looking northeast from the lot. Thrown Tractor Trailer
1. The tractor trailer box on the left is flat to the ground with a dam-like
line of
rubble left by Hurricane Katrina. The tractor-trailer box might have been
pushed to make space for the road to be opened but it is flat to the ground.
It had to be the first object to arrive.
2. House in the center looks untouched, except for some roof damage.
3. House on the left lost most of its roof.
4. Two trees are leaning toward the left, or in a northwest direction.

tractor trailer

This picture was taken looking from the east side of the property, looking
south. Part of the foundation wall is broken near the middle of the inside
of the house wall. The wall shows:
1. Three bolts coming out of the foundation wall are damaged.
a. One bolt at the top of the picture is bent toward the southwest.
b. Second bolt at the bottom of the picture is bent toward the northwest.
c. The middle bolt is cut off.
2. The foundation wall is damaged toward the inside of the house.

Hurricane Katrina Study of Home Foundation

This picture was taken from the left side of tractor-trailer box that was
in Picture 3, with parts of the house in the wheel-well. This is a good
example of inclusion. Inclusion Example

Inclusion

This picture of the Gulfport study was taken looking north from the property. The tractor-trailer
box is leaning to the right, or pushed toward to the right, against the
trees.

The tractor-trailer box was deposited first than the other sediment (debris)
was deposited from the left side or from the southwest direction hitting
the truck and pushing it to the right and is a good example of original
horizontal sediment. Leaning Tractor Trailor

Tractor Trailer

This picture was taken from the middle of the west side of the property
line, looking east. Parallel Debris
1. Two pipes from the building are laying parallel on different sides of
the property. Both were attached to the ground at the base. They are pointing
from the southerly to the northerly direction.
2. Most of the debris in the middle of the foundation floor also was parallel
to each of the pipes.
3. Two other pieces of debris are more in a west-southwest to east-northeast
direction.

Hurricane Katrina Research Debris Research

This was taken from the middle of the foundation floor looking northeast.
The scraped lines on the concrete can be seen on the foundation slab and
shows events that were cross-cut.
1. The more impressive lines are in the same direction line as the grooved
lines and the tractor-trailer box in Picture 1. All three are in the west-southwest
to east-northeast direction, marked “A” in the picture.
2. The less impressive lines can be seen going at different angles to the
more impressive line. The majority of the less impressive lines are almost
parallel to the right side of the foundation wall, marked “B.” in the picture
3. Another line is almost at a 90 degree angle to the foundation wall, marked
“C.” Near to this line the foundation wall is broken.
4. Red paint on the foundation slab is visible. Crosscut Lines

Hurricane Katrina Lines in Concrete

This picture was taken looking northwest from the southwest corner of the
property. Evidence Lines
1. Lines grooved into the concrete are in the west-southwest to east-northeast
direction. One is visible in this picture; it breaks the concrete on parts
of the walkway and driveway. The red tractor-trailer box in the background
is in direct grooved lines with the lines in the concrete.
2. The tree on the right side of the lot is down from impact.
3. Other trees in the background show:
a. Large open area with a tree to the right, which does not have visible
damage.
b. Two trees just off center and to the left, are leaning to the left.

Tree Study and Foundation Study

Photo enlargement of NOAA.

Downburst Research

Hurricane Katrina Straight Line Wind Field Study at Southwinds Golf Course Area near Ocean Springs, Mississippi.

I found a number of straight-line paths Southwinds Golf Course. We walked east, when the straight-line wind pattern moved due south. (See picture 2.) We changed directions and walked between two homes that were damaged during Hurricane Katrina. (See picture 3.)

As we walked down Barbaretta Drive, the damage to the houses increased. We turning right on Dismuke at the corner of Crescent Shore Drive the two houses near the corner were both very damaged. A tree was down between the houses, showing the wind came from the south. (See picture 5.) Turned down Crescent Shore Drive, we found two trees on the left side lot had been splintered. (See picture 6.) The rest of the lot was being cleaned up, the house was gone, but a tree on the west side of the lot was down, showing the wind came from the west. (See picture 7.) Across the street and down one lot, we found another tree that was splintered. (See picture 8.) Starting at these three points, eight of ten houses were gone; only one was in the process of being rebuilt. The trees surrounding this area were going in all different directions, in a classic starburst pattern. (See picture 9.) Four houses that were built on concrete pillars were gone but the pillars now were pointing in different directions. (See picture 10 and 11.) The houses must have crashed straight downward as the air dropped down, blowing the foundation pillars into a starburst pattern, i.e., going in different directions.

Map of Ocean Springs Hurricane Winds Research Area

I had found the touchdown area. This was a very strong microburst area.I hoped no one was in these houses when the downburst hit because that would have crashed into them. The trees in the wooded area surrounding this area showed starburst patterns to them, going in different directions. (See picture 12 and 15.) The straight-line tree pattern led me to this place and I felt I was in a graveyard. Later, I found two additional touchdown areas that affected this area with possible tornadoes, mini-swirls, gustnadoes, microbursts and straight-line winds
In the Plains States and other high tornado areas, people believe that they were hit by a tornado but in reality they were hit with straight-line winds or a microburst touchdown area. If the victims stated that the tornado was noisy, like a train, they most likely were hit by straight-line winds traveling out of a microburst. In the latter instance the wind would be pushing things over as it is traveling along at a high speed at, or near the ground level. The destruction is often at an angle away from the general wind pattern hit at that time. Or if the victims stated the tornado came straight down, it is most likely that there was downward flow of air. Often microburst touchdown areas just missed the person telling the story.

Many people say the difference between a tornado and straight-line winds is that straight-line winds do not have a vortex that extends upward into the atmosphere. Dr. Ted Fujita in his books points out that descending air is a vortex downward. The touchdown area he called, microburst,& is very damaging as well as the straight-line winds coming out at all directions from the touchdown area.

I realize that downbursts are considered rare events during hurricanes because the winds would push the air enough horizontally to give that air a soft landing as the air above is descending downward. During hurricanes, most people would say that the rain was flying sideways. This horizontal wind would give the falling atmospheric air a soft landing. Dr. Ted Fujitas studies indicated that a microburst diminished and stopped when a horizontal wind speed reaches about 35 meters per second. This would lead one to believe that all downbursts would not leave a major impact on the impacted area. But consider this: most anemometers recorded top winds speed at about 50 mile per hour before they stopped functioning. Hurricane Katrinas unstable cloud structure reached over 6 miles into the atmosphere. When the vortex descended downward, if the horizontal wind speed was low at that location, the touchdown area would have a hard landing. It would flatten the trees and houses at Ascot Point on the Southwinds Golf Course. The straight-line winds coming out of the touchdown area would travel in all directions and could be traveling at 120 to160 miles per hour. I found evidence of downburst in surrounding areas but did not have the time to do a detailed study. (See pictures 16, 26 and 27.)

In summation, the scientific method investigation into why Hurricane Katrinas damage was so large led me to a better understanding of what happens during hurricanes. My studies led me to understand the devastating power of downburst and the immense importance for understanding how it affects houses.

As with any scientific investigation, my opinions, hypotheses and conclusions are subject to study, questions, and revisions as more information is gathered.

Thank You for Research Help

Hurricane Katrina Study Acknowledgements

A Big Thanks to All of the Help I Received During this Hurricane Katrina Project

Video:
WLOX ABC 13 the Station for South Mississippi: Katrina South Mississippi Story

National Geographic Society: Cyclones

David Jungblut, Geologist: Wind or Water

Websites:
National Oceanic and Atmospheric Administrations National Geodetic Survey: Hurricane Katrina Images

United States Geological Survey: Hurricane Katrina Impact Studies

Articles:
David Jungblut, Geologist: Geological Principles and Hurricane Katrina

David Jungblut, Geologist: Why Were So Many Properties Destroyed During Hurricane Katrina?

David Jungblut, Geologist: How Was My House Destroyed; Was It by Wind or Water?

Books:
T. Theodore Fujita: DFW Microburst ON August 2, 1985
T. Theodore Fujita: The Downburst Microburst and Macroburst

A number of Oakcrest High School staff members have helped me, they include:

Joanne Carr and Brenna Baker, with editing;

Chris Monroe, with smart board technology;

Charles Chip Lockwood III, with a documentary of the trips to Mississippi.

Three students have worked on the documentary; they are: Colleen Dirkes, Leanna Dattolo and Kierstin Wunder.

Christopher Sopuch, with placing my paper with pictures on the web. Two students are working with him; they are: Vincent Brunetti and Gena Petrillo.

I am teaching students how to evaluate pictures from the hurricane site. To help with assess damage. Some students that are doing nice work are Michael Schumacker and Todd Dorn.

Brenna Baker, Joe Seaman, Lea Fitzpatrick and Nathan Schreiber have helped with content discussions.

Joe Hockreiter, senior environmental specialist from Yardley, Pennsylvania has conducted a peer review of my research.

Future plans include using my research as a teaching tool and having students do projects related to events that happened during Hurricane Katrina.

Earth is Moving Three Ways at the Same Time

Earth is moving three ways at the same time.  One, the earth is spinning on the axis called rotation; one full rotation is one day.  Two, the earth is orbiting the sun; one full orbit is a year.  The earth and the rest of the solar system are also orbiting the center of the Milky Way Galaxy.

The Earth is rotating on its axis.
earth-rotating-axis 

The Earth is orbiting the sun
earth-orbiting-sun.

The Earth, Sun and the rest of the solar system is orbiting the center of the Milky Way Galaxy.
solar-system-orbiting-milky-way-galaxy 

Newton First Law describes the Earth’s rotation by stating, once in motion the Earth will stay in motion unless acted on a net force.  The orbiting is explained by the net force acting on the Earth.  The Earth has momentum to move away from the Sun (called a horizontal force) at the same time the Earth is falling toward the Sun (called a vertical force).    The two force acting on the Earth causes the acceleration of the Earth move in the orbit.  As an example place your right arm out to the side and place the other in front of you, so you have a 90 degree difference, try to follow both at the same time.  You have to step between the two, resulting in you acceleration alone the net force.   In summation the Earth is moving three different ways at once it is rotation on it axis, orbiting the sun and orbiting the galaxy with the rest of the solar system.